On this page
Highlights
I put “information” in quotes because, technically speaking, information is something that is true. Most of us don’t use the word like that, and that helps to blur the distinction between what we know and what we don’t know. Similarly, for just about any topic we can think of, the Internet rapidly and mindlessly delivers numbers, statistics, graphs, charts, and conclusions—unfortunately, not all of them are factual. A fact is something that is known to be true. Everything else is a fact-in-waiting (to be verified), or an outright lie. Often, only one side of a story we read is supported by information and facts, and the other side is being propped up by lies, jibber-jabber, and mumbo-jumbo masquerading as facts.
I offer this book with no political agenda or bias. I believe that for us to have civil, respectful, and rational discourse about any issue, we need to at least agree first on what the facts are. Then, reasonable people may disagree about how to weigh that evidence and what conclusions to form from it. Everyone, of course, is entitled to their own opinions. But they are not entitled to their own facts.
Sometimes the evidence we’re given consists of numbers. We should get in the habit of asking, “Where did those numbers come from? How were they collected?” Sometimes the numbers are ridiculous, but it takes some reflection to see it. Sometimes claims seem reasonable, but come from a source that lacks credibility, like a person who reports having witnessed a crime but wasn’t actually there. This is the basis of infoliteracy.
The best defense against sly prevaricators, the most reliable one, is for every one of us to learn how to become critical thinkers. We are a social species, and we tend to believe what others tell us. And our brains are great storytelling and confabulation machines: Given an outlandish premise, we can usually generate fanciful explanations for how it might be so. But that’s the difference between creative thinking and critical thinking, between lies and the truth: The truth has factual, objective evidence to support it. Some claims might be true, but truthful claims are true.
Statistics, because they are numbers, appear to us to be cold, hard facts. It seems that they represent facts given to us by nature and it’s just a matter of finding them. But it’s important to remember that people gather statistics. People choose what to count, how to go about counting, which of the resulting numbers they will share with us, and which words they will use to describe and interpret those numbers. Statistics are not facts. They are interpretations. And your interpretation may be just as good as, or better than, that of the person reporting them to you.
When conducting plausibility checks, we don’t care about the exact numbers. That might seem counterintuitive, but precision isn’t important here. We can use common sense to reckon a lot of these: If Bert tells you that a crystal wineglass fell off a table and hit a thick carpet without breaking, that seems plausible. If Ernie says it fell off the top of a forty-story building and hit the pavement without breaking, that’s not plausible. Your real-world knowledge, observations acquired over a lifetime, tells you so. Similarly, if someone says they are two hundred years old, or that they can consistently beat the roulette wheel in Vegas, or that they can run forty miles an hour, these are not plausible claims.
Percentages seem so simple and incorruptible, but they are often confusing. If interest rates rise from 3 percent to 4 percent, that is an increase of 1 percentage point, or 33 percent (because the 1 percent rise is taken against the baseline of 3, so 1/3 = .33). If interest rates fall from 4 percent to 3 percent, that is a decrease of 1 percentage point, but not a decrease of 33 percent—it’s a decrease of 25 percent (because the 1 percentage point drop is now taken against the baseline of 4). Researchers and journalists are not always scrupulous about making this distinction between percentage point and percentages clear, but you should be.
The median is the middle number in a set of numbers (statisticians call this set a “distribution”): Half the observations are above it and half are below. Remember, the point of an average is to be able to represent a whole lot of data with a single number. The median does a better job of this when some of your observations are very, very different from the majority of them, what statisticians call outliers.
The median here would be $100,000: Four people make less than that amount, and four people make more. The mode is $101,000, the number that appears more often than the others. Both the median and the mode are more helpful in this particular example.
Also be careful to remember that the average doesn’t tell you anything about the range. The average annual temperature in Death Valley, California, is a comfortable 77 degrees F (25 degrees C). But the range can kill you, with temperatures ranging from 15 degrees to 134 degrees on record.
Another thing to watch out for in averages is the bimodal distribution. Remember, the mode is the value that occurs most often. In many biological, physical, and social datasets, the distribution has two or more peaks—that is, two or more values that appear more than the others.
But be careful drawing conclusions about individuals and groups based on averages. The pitfalls here are so common that they have names: the ecological fallacy and the exception fallacy. The ecological fallacy occurs when we make inferences about an individual based on aggregate data (such as a group mean), and the exception fallacy occurs when we make inferences about a group based on knowledge of a few exceptional individuals.
Now that you’re an expert on averages, you shouldn’t fall for the famous misunderstanding that people tended not to live as long a hundred years ago as they do today. You’ve probably read that life expectancy has steadily increased in modern times. For those born in 1850, the average life expectancy for males and females was thirty-eight and forty years respectively, and for those born in 1990 it is seventy-two and seventy-nine. There’s a tendency to think, then, that in the 1800s there just weren’t that many fifty- and sixty-year-olds walking around because people didn’t live that long. But in fact, people did live that long—it’s just that infant and childhood mortality was so high that it skewed the average. If you could make it past twenty, you could live a long life back then.
All these cases involve a shift of the baseline, or sample group we’re studying. When we calculate the average number of children per family, we’re sampling families. A very large family and a small family each count as one family, of course. When we calculate the average (mean) number of siblings, we’re sampling children. Each child in the large family gets counted once, so that the number of siblings each of them has weighs heavily on the average for sibling number. In other words, a family with ten children counts only one time in the average family statistic, but counts ten times in the average number of siblings statistic.
This graph obviously tells a very different story. Which one is true? You’d need to have a measure of how the one variable changes as a function of the other, a statistic known as a correlation. Correlations range from −1 to 1. A correlation of 0 means that one variable is not related to the other at all. A correlation of -1 means that as one variable goes up, the other goes down, in precise synchrony. A correlation of 1 means that as one variable goes up, the other does too, also in precise synchrony. The first graph appears to be illustrating a correlation of 0, the second graph appears to be representing one that is close to 1. The actual correlation for this dataset is .91, a very strong correlation. Spending more on students is, at least in this dataset, associated with better SAT scores.
Post hoc, ergo propter hoc (after this, therefore because of this). This is a logical fallacy that arises from thinking that just because one thing (Y) occurs after another (X), that X caused Y. People typically brush their teeth before going off to work in the morning. But brushing their teeth doesn’t cause them to go to work. In this case, it is even possibly the reverse.
You go out in your garden and see a dandelion that’s four inches high on Tuesday. You look again on Thursday and it’s six inches high. How high was it on Wednesday? We don’t know for sure because we didn’t measure it Wednesday (Wednesday’s the day you got stuck in traffic on the way home from the nursery, where you bought some weed killer). But you can guess: The dandelion was probably five inches high on Wednesday. This is interpolation. Interpolation takes two data points and estimates the value that would have occurred between them if you had taken a measurement there.
How high will the dandelion be after six months? If it’s growing 1 inch per day, you might say that it will grow 180 inches more in six months (roughly 180 days), for a total of 186 inches, or fifteen and a half feet high. You’re using extrapolation. But have you ever seen a dandelion that tall? Probably not. They collapse under their own weight, or die of other natural causes, or get trampled, or the weed killer might get them. Interpolation isn’t a perfect technique, but if the two observations you’re considering are very close together, interpolation usually provides a good estimate. Extrapolation, however, is riskier, because you’re making estimates outside the range of your observations.
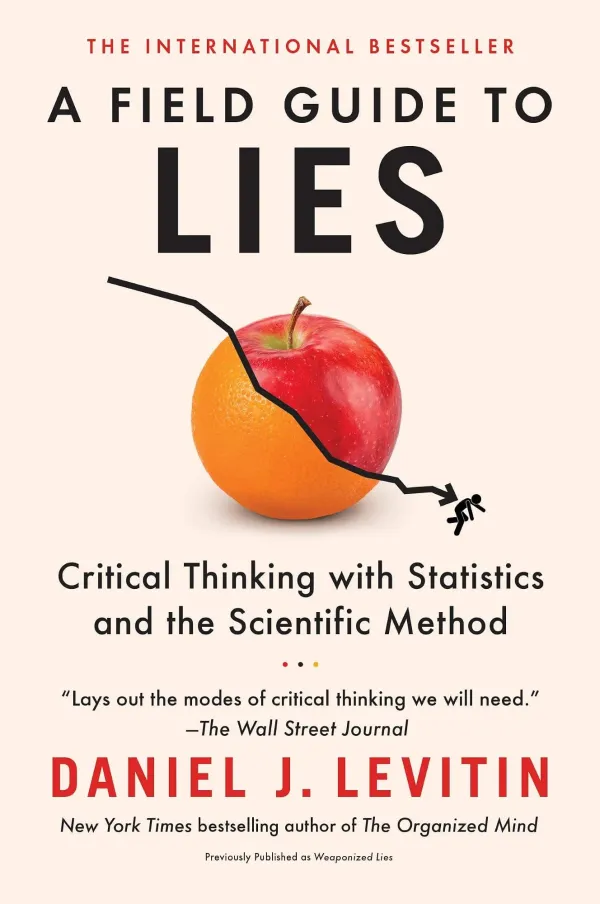
Access is one of those words that should raise red flags when you encounter them in statistics. People having access to health care might simply mean they live near a medical facility, not that the facility would admit them or that they could pay for it. As you learned above, C-SPAN is available in 100 million homes, but that doesn’t mean that 100 million people are watching it. I could claim that 90 percent of the world’s population has “access” to A Field Guide to Lies by showing that 90 percent of the population is within twenty-five miles of an Internet connection, rail line, road, landing strip, port, or dogsled route.
An equally plausible argument is that over the twelve-year period, increased specialization and technology growth created more opportunities for doctors and so there were more available positions, accounting for the increase in the total number of doctors. What about the salary decline? Perhaps many older doctors retired, and were replaced by younger ones, who earn a smaller salary just out of medical school. There is no evidence presented either way. An important part of statistical literacy is recognizing that some statistics, as presented, simply cannot be interpreted.
As another example, you might want to talk about unemployment as a general problem, but this risks combining people of very different backgrounds and contributing factors. Some are disabled and can’t work; some are fired with good cause because they were caught stealing or drunk on the job; some want to work but lack the training; some are in jail; some no longer want to work because they’ve gone back to school, joined a monastery, or are living off family money. When statistics are used to influence public policy, or to raise donations for a cause, or to make headlines, often the nuances are left out. And they can make all the difference.
The job of the statistician is to formulate an inventory of all those things that matter in order to obtain a representative sample. Researchers have to avoid the tendency to capture variables that are easy to identify or collect data on—sometimes the things that matter are not obvious or are difficult to measure. As Galileo Galilei said, the job of the scientist is to measure what is measurable and to render measurable that which is not. That is, some of the most creative acts in science involve figuring out how to measure something that makes a difference, that no one had figured out how to measure before.
The margin of error is how accurate the results are, and the confidence interval is how confident you are that your estimate falls within the margin of error. For example, in a standard two-way poll (in which there are two possibilities for respondents), a random sample of 1,067 American adults will produce a margin of error around 3 percent in either direction (we write ±3%). So if a poll shows that 45 percent of Americans support Candidate A, and 47 percent support Candidate B, the true number is somewhere between 42 and 48 percent for A, and between 44 and 50 percent for B. Note that these ranges overlap. What this means is that the two-percentage-point difference between Candidate A and Candidate B is within the margin of error: We can’t say that one of them is truly ahead of the other, and so the election is too close to call.
Counterknowledge, a term coined by the U.K. journalist Damian Thompson, is misinformation packaged to look like fact and that some critical mass of people believes. A recent US president-elect, having won the electoral college, claimed to have won the popular vote as well, when there was strong and documented evidence that that was not the case. The counterknowledge was repeated. Shortly thereafter, a survey revealed that 52 percent of the president-elect’s supporters, tens of millions of people, believed this falsity. It’s not just in politics that counterknowledge propagates. Examples come from science, current affairs, celebrity gossip, and pseudo-history. Sometimes vast conspiracies are alleged, such as in the claims that the Holocaust, moon landings, and attacks in the United States on September 11, 2001, never happened. Sometimes it is the outlandish claim that a pizza parlor is a front for a child sex ring run by the former U.S. Secretary of State.
The development of critical thinking over many centuries led to a paradigm shift in human thought and history: the scientific revolution. Without its development and practice in cities like Florence, Bologna, Göttingen, Paris, London, and Edinburgh, to name just a handful of great centers of learning, science may not have come to shape our culture, industry, and greatest ambitions as it has. Science is not infallible, of course, but scientific thinking underlies a great deal of what we do and of how we try to decide what is and isn’t so. This makes it worth taking a close look behind the curtain to better see how it does what it does. That includes seeing how our imperfect human brains, those of even the most rigorous thinkers, can fool themselves.
We got our dog Shadow, a Pomeranian-Sheltie mix, from a rescue shelter when he was two years old. He got his name, we learned, because he would follow us from room to room around the house during the day, never far away. As often happens with pets, our rhythms synchronized—we would fall asleep and wake up at the same time, get hungry around the same time, feel like getting exercise at the same time. He traveled with us often on business trips to other cities, becoming acclimated to planes, trains, and automobiles.
David Blaine is a celebrity magician and illusionist. He claims to have completed great feats of physical endurance (at least one was recognized by the Guinness Book of World Records). The question for a critical thinker is: Did he actually demonstrate physical endurance or was he using a clever illusion? Certainly, as a skilled magician, it would be easy for him to fake the endurance performances.
Nineteen Eighty-four was published in 1949, half a century before the Internet became our de facto information source. Today, like in 1984, websites can be altered so that the average person doesn’t know that they have been; every trace of an old piece of information can be rewritten, or (in the case of Paul McCartney and Dick Clark) kept out of reach. Today, it can be very difficult for the average Web surfer to know if a site is reporting genuine knowledge or counterknowledge. Unfortunately, sites that advertise that they are telling the truth are often the ones that aren’t. In many cases, the word “truth” has been co-opted by people who are propagating counterknowledge or fringe viewpoints that go against what is conventionally accepted as truth. Even site names can be deceptive.
28 highlights, exported from my Kindle via Readwise.